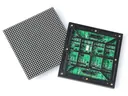
 Outdoor SMD Screens
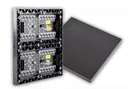 Indoor SMD Screens
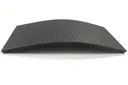 Flexible SMD Screens

The Future of Digital Menu Boards in the Food Industry
Digital menu boards are changing how restaurants and cafes present their menus. We compare LCD, direct-view LED, e-paper and touch…
Display advertising, whether online banners or ads on digital screens, is no longer just about eye-catching visuals and clever taglines. Data analytics helps advertisers understand what is working, test alternatives and make better decisions. In this article we look at how analytics supports display advertising, how to read results fairly, and how the same ideas apply to ads on SMD LED screens.
Understanding your audience’s behaviour and preferences is basic to effective advertising. Segmentation divides audience data into smaller, meaningful groups so messages can be better matched to each group. Online, segments may be based on location, device, site behaviour or purchase history, collected with proper consent. For digital screens, the equivalent data is usually anonymous: location, time of day, footfall and what played when.
Examples of useful segments:
Segmentation helps move away from generic messages, but it should respect privacy laws and use only data you are allowed to use.
Real-time analytics lets advertisers adjust campaigns while they run. Online, common indicators include click-through rate (CTR), conversion rate and impressions. For digital screens, useful data includes play logs (proof of what played and when), footfall counts, QR code scans and promo code redemptions.
A/B testing compares two versions of an ad that differ in one element, such as the visual, headline or call to action. To be meaningful, both versions need comparable exposure (same period, audience and placement) and a large enough sample. A difference that looks big on small numbers may be chance. The table below is a hypothetical example for illustration only:
| Ad Variant (hypothetical) | Impressions | Clicks | Conversions |
|---|---|---|---|
| Variant A | Equal share, same period | Recorded | Recorded |
| Variant B | Equal share, same period | Recorded | Recorded |
Before declaring a winner, check that the exposure was comparable, the sample is large enough, and the difference is statistically significant (most ad platforms and simple online calculators can test this). Then repeat the test to confirm. Combining real-time data with structured experiments gives a sounder basis for decisions than gut feeling.
Predictive modelling uses historical data to estimate how campaigns might perform, helping marketers decide where and when to spend. Models can suggest which segments are more likely to respond or which times work better. They reduce guesswork but do not remove it: predictions are only as good as the data behind them and can be wrong when conditions change, so results should be checked against actual performance.
Common uses include:
| Predictive Insight | How to Use It |
|---|---|
| Segment likely to respond | Test a tailored creative for that segment and measure the result |
| Better-performing time slot | Shift some spend or screen time there and compare with the previous period |
Content that fits a specific audience usually performs better than generic content. Online, tools such as heatmaps show how users interact with pages, and dynamic creatives can change images or copy based on context. On digital screens, content can be scheduled by location, time of day or weather. A/B testing different visuals, copy and calls to action helps identify what works, provided the tests are run fairly.
Some examples of segments and matching content strategies:
| Segment | Content Strategy |
|---|---|
| First-time visitors | Introduce your brand with clear storytelling and value propositions. |
| Returning shoppers | Show relevant offers, using browsing or purchase data only where users have consented. |
| Cart abandoners (online) | Use retargeting reminders, within platform and privacy rules. |
| Screen audiences by daypart | Schedule different messages for morning commuters and evening shoppers. |
Q1: Why is data analytics important for display advertising?
It shows how audiences respond, helps track performance and supports better decisions on creative, timing and spend.
Q2: What data is used?
Online: impressions, clicks, conversions, device and location data, collected with appropriate consent. Digital screens: play logs, footfall counts, QR scans and promo code redemptions.
Q3: How does predictive analytics help targeting?
It uses past data to estimate which audiences or times are more likely to respond. Treat predictions as a starting point and check them against real results.
Q4: What role does A/B testing play?
It compares versions of an ad to see which performs better. Results are only reliable with comparable exposure, a large enough sample and a check for statistical significance.
Q5: Where is data-driven display advertising heading?
Towards more automated, context-aware content, shaped by privacy laws and platform rules on what data can be used.
Data analytics helps advertisers replace guesswork with evidence, online and on digital screens. The key is to measure the right things, run fair tests, respect privacy and treat results with healthy caution.
Choosing a screen? Compare indoor SMD screens and outdoor SMD screens, browse our SMD screen products, or ask for a free quote.
Digital menu boards are changing how restaurants and cafes present their menus. We compare LCD, direct-view LED, e-paper and touch…
How programmatic advertising works online, on connected TV and on digital billboard networks: buying methods, an example workflow, and its…
How to adapt display marketing, online and on LED screens, for different audiences using real research instead of stereotypes, with…