Digital out-of-home (DOOH) advertising turns streets, airports and transit hubs into places where brands can show changing, timely messages. But how do you measure whether it works? Unlike online ads, where clicks are easy to count, DOOH measurement relies on estimates and indirect signals. This article explains the main metrics, where the data comes from, its limits, and practical ways to judge a campaign. It is general guidance; the measurement available in Pakistan depends on each screen operator and data provider.
Table of Contents
Understanding Key Metrics in Digital Out-of-Home Advertising
It is important to separate what can be counted directly from what is estimated. Proof of play (how many times your ad was shown) can be logged by the screen’s system. Audience impressions (how many people were likely to see it) are estimates, based on traffic or footfall data and assumptions about visibility. Other measures such as dwell time and unique reach are also modelled, not guaranteed.
Common metrics:
| Metric |
Description |
Why It Matters |
| Plays (proof of play) |
The number of times your content was displayed, from the screen’s logs. |
Confirms the campaign ran as booked. |
| Estimated Impressions |
Estimated number of people likely to have seen the ad, based on audience data and visibility assumptions. |
Indicates potential reach; ask how it is calculated. |
| Engagement |
Measurable responses such as QR scans or interactions on interactive screens. |
Shows some audience interest. |
| Audience Match |
How well the estimated audience fits your target. |
Helps judge relevance. |
Location comparisons and response tracking, for example campaign-specific QR codes, web pages or promo codes, can add evidence of performance. Together, these help brands judge campaigns and improve future ones.
DOOH measurement draws on several data sources, each with strengths and limits. Screen logs confirm when ads played. Audience estimates may come from traffic counts, footfall counters or aggregated mobile location data supplied by providers. Ask any provider how data is collected, whether it is anonymised and lawfully obtained, and how accurate it is.
Advertisers can also use social listening to track mentions of a campaign, and aggregated mobile data to study general foot-traffic patterns. These indicate associations, not proof that a specific ad caused a visit. Key sources:
| Data Source |
Key Insights |
| Screen Logs (Proof of Play) |
When and how often ads played |
| Audience Estimates |
Estimated reach and audience profile |
| Social Listening |
Mentions, sentiment |
| Aggregated Mobile Location Data |
General foot-traffic patterns (estimates) |
Optimizing Campaign Strategies Through Timely Insights
Where a screen network supports it, content can be changed based on conditions such as time of day or weather. For example, a campaign for cold drinks could run more during hot afternoons. This can make ads more relevant.
- Contextual Content: Adjust creative by location and time, based on aggregated audience information rather than identifying individuals.
- Performance Review: Compare proof of play and response data across locations and times.
- Real-World Triggers: Respond to events, temperature or traffic patterns where data feeds are available.
Examples of how insights can be used:
| Insight Type |
Example Use Case |
| Weather Data |
Show seasonal offers during rain or heat. |
| Audience Estimates |
Adjust frequency in busier locations or times. |
| Event Details |
Run relevant content during festivals or sports events. |
Using Analytics for Actionable Recommendations
Analytics can help move beyond play counts. Comparing results across locations, times and creatives can show which placements and messages perform better. More advanced methods, such as comparing areas with and without the campaign, or statistical models, can estimate the effect on visits or sales, but always with uncertainty.
Potential benefits of analytics-driven DOOH:
- Better Spending Decisions: Focus budget on placements and times that appear to work better.
- Data-Informed Creativity: Learn which messages get more response.
- Ongoing Optimization: Adjust campaigns as evidence builds up.
- Cross-Channel Integration: Coordinate messages with mobile and social campaigns.
The table below shows the kind of results a campaign report might include. The figures are illustrative only, not data from a real campaign:
| Metric |
Illustrative Value |
How It Might Be Used |
| QR Scan Rate (scans per estimated impression) |
Example only |
Compare creatives |
| Highest-Response Time Band |
e.g. evening |
Shift budget towards stronger times |
| Repeat Exposure |
Example only |
Judge frequency |
Q&A
Measuring the Effectiveness of Digital Out-of-Home Advertising: 5 Key Questions Answered
1. What is Digital Out-of-Home (DOOH) Advertising?
DOOH advertising uses electronic displays in public spaces such as transit hubs, shopping centres and roadsides. Unlike static billboards, content can be changed remotely and, on some networks, scheduled by time or conditions or bought programmatically.
2. How Can Advertisers Track the Impact of DOOH Campaigns?
Start with proof of play and the operator’s audience estimates. Add response tracking such as campaign-specific QR codes, web pages or promo codes, and compare sales or visits during and outside the campaign. Location-data studies can estimate visits among people who passed a screen, but they depend on lawfully collected data, cannot show who actually saw the ad, and carry uncertainty.
3. What Role Does Audience Measurement Play in Evaluation?
Audience estimates help compare locations and plan reach. Some systems use sensors or cameras to count people or estimate dwell time. Any such technology raises privacy questions: it should be used only where lawful, with clear notices, data minimisation (ideally counting without identifying anyone or storing images), security and limited retention. Treat demographic estimates as approximate.
4. What Metrics Define Success for a DOOH Campaign?
It depends on the goal. Awareness campaigns focus on plays, estimated reach and frequency, sometimes with recall surveys. Response campaigns focus on measurable actions such as scans, website visits, promo-code use or sales.
5. Is Creative Optimization Vital in DOOH Effectiveness?
Yes. Clear visuals, simple messages and content suited to the context generally perform better. Testing different creatives and comparing results helps improve campaigns over time. On roadside screens, keep content simple and follow local rules.
To Sum Up
Measuring DOOH is less straightforward than measuring online ads, but it is possible to build a useful picture: confirm ads ran, understand estimated audiences and their limits, track responses, and compare results across locations and creatives. Used carefully and with respect for privacy, these methods help brands learn what works and improve future campaigns.
Choosing a screen? Compare indoor SMD screens and outdoor SMD screens, browse our SMD screen products, or ask for a free quote.
Planning a screen?Call 0306-1333384 or send your size and location for a free quote.
Contact us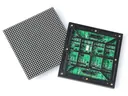 Outdoor SMD Screens
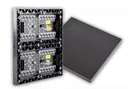 Indoor SMD Screens
 Flexible SMD Screens